Correlation vs. causation
"Correlation does not imply causation" - you've probably heard this phrase numerous times. Yet, when confronted with headlines such as "Coffee consumption is linked to higher mortality" or "Children who eat breakfast have better grades," often the first thought that comes to mind is that there is a causal connection. What else should account for these correlations than a cause-effect relation? Before diving deeper, let's clarify the distinction between correlation and causation.
Imagine you're conducting a study. You recruit 1000 participants, ask them about their coffee-drinking habits every year, and then record at which age they die. You observed that participants who drank more coffee tended to die earlier. This type of connection you see in the data is a correlation; that is, a particular type of combination of values occurs more often. The correlation is negative in this case, meaning more coffee consumption is linked to lower life expectancy. But does this imply a causal connection, that is, drinking coffee leads to a shorter life? It doesn't. But why?
Hidden confounders
It turns out that if you had also asked your study participants whether they smoke or not, a different picture emerges. When you look at the correlation between coffee consumption and life expectation in the group of non-smokers versus smokers separately, the correlation disappears or is even slightly positive, i.e., the coffee drinkers live longer on average. Smoking here is a so-called hidden confounder - a third variable that influences both other variables: Smoking is detrimental to your health, and smokers also tend to drink more coffee (Bjørngaard et. al., 2017).
This phenomenon often accounts for correlation. Other examples illustrating this1 include the strong correlations between
- Nobel prize winners and chocolate consumption, as illustrated in Figure 14 above;
- Ice cream sales and shark bites;
- Atmospheric CO2 level and obesity levels.
Unfortunately, eating chocolate does not increase intelligence. Instead, countries with higher GDP tend to have more Nobel laureates as well as higher chocolate consumption. Similarly, increased temperatures lead to higher sales of ice cream and a rise in shark bite incidents. Since 1950, both CO2 levels and obesity have risen, so time is the common factor. The previously mentioned link between breakfast and grades may result from how much time parents dedicate to their children. While it might be obvious that eating ice cream does not lead to shark bites, in many situations, it's difficult to distinguish between an actual cause-effect relation and correlation. For instance, because of the negative correlation between coffee consumption and health, the WHO recommended limiting its intake for many years. It took years to find out that smoking is a hidden confounder and that coffee consumption may actually be beneficial for health (Thomas & Hodges, 2020).
What to do?
Given how misleading correlations can be, what methods help us to distinguish causation from confounding? One approach is randomized controlled trials (RCT), which work as follows
- You gather study participants.
- You randomly split them into two groups: treatment and control group.
- The control group receives some intervention, such as a coffee, while you give a placebo or no treatment at all to the control group.
- You compare the health status of group A versus group B.
Since you intervened on group A by forcing them to drink coffee, you can draw the conclusion that coffee causes better health if the people in A reported better health. This approach led to numerous scientific discoveries. However, it is not always applicable. Let's say you want to test the effect of smoking on health. Here, it is unethical to force people to smoke. Similarly, if you want to test the impact of increasing minimum wages, you can't simply gather 100 countries and force half of them to increase their minimum wages.
This is where causal inference techniques come into play, which allow researchers to deduce cause-effect relations without conducting randomized controlled trials. One notable method is the instrumental variable approach, which seeks to substitute the random assignment in the RCT by a natural process, the so-called instrument. For instance, a study examining the effects of smoking during pregnancy on newborn weight used variations in tobacco taxes over time as an instrument. The key here is that these taxes do not have some direct connection to some potential confounders, as summarized in the following graph
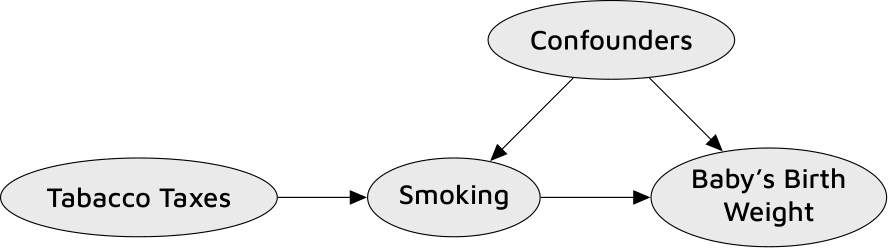
Thus, while hidden confounding may influence the correlation between smoking and baby weight, the correlation between tobacco taxes and baby weight remains unaffected by those confounders. Even more, when you observe some correlation between the taxes and the weight, this can only be due to the connection via the mother's smoking. In mathematical terms, the causal effect tabacco taxes to baby's weight is the product of the effects tabacco taxes to smoking and smoking to baby's weight. Therefore, we can calculate the causal effect of smoking on weight by dividing the covariance2 of taxes and weight by the covariance of taxes and smoking and proof that smoking indeed causes bad health outcomes3.
Despite the difficulties associated with causal discovery, such as identifying valid instruments, or the even more difficult case of causal feedback loops not discussed here, it is a highly active research field. This will hopefully progress our ability to uncover causal relationships effectively. If you're interested in further causality methods, check out the books Pearl and Mackenzie. "The Book of Why: The New Science of Cause and Effect" or Peters et. al. "Elements of Causal Inference".
References:
[1]: These as well as many more examples can be found on the website spurious correlations by Tylor Vigen.
[2]: The covariance is similar to the correlation; for the precise definition, see here.
[3]: This assumes linear relations between all covariates. However, this method can be generalized to non-linear settings as well. For further details see for example this blog post or Chapter 4 in Angrist, Joshua D., and Jörn-Steffen Pischke. (2008). Mostly Harmless Econometrics: Instrumental Variables. Lecture notes from MIT course 14.32.
[4]: Image from Messerli, 2012.